The complexities of managing large-scale data storage have driven the development of specialized diagnostic and planning utilities, leading to a closer examination of how digital infrastructure calculates usable capacity, rebuild risks, and power consumption. Modern storage management requires precise mathematical calculations to balance capacity, hardware redundancy, and long-term data integrity across diverse environments.
How to Use This RAID Calculator
Navigating the configuration of multi-drive storage arrays has traditionally required a deep understanding of storage math, but modern web-based utilities aim to simplify the process. Users can interact with these systems by inputting parameters to evaluate prospective storage layouts, saving specific configurations, or generating shareable links. Because these platforms execute all calculations client-side within the browser, sensitive system configuration data never leaves the local machine, ensuring user privacy while streamlining hardware planning.
How Usable Capacity is Calculated
At the heart of any storage layout evaluation is the relationship between the number of drives, designated as N, and the size of the smallest drive in the array, designated as S. Different RAID levels distribute data and parity in distinct ways, dictating both the final storage volume available to the user and the level of fault tolerance.
For basic striping configurations like RAID 0, which utilizes a minimum of two drives, the usable capacity is calculated simply as N multiplied by S, though it offers zero fault tolerance. Conversely, mirroring solutions such as RAID 1 dedicate half their capacity to duplicating data, resulting in a usable space equal to a single drive S, while surviving the failure of up to N minus one drives.
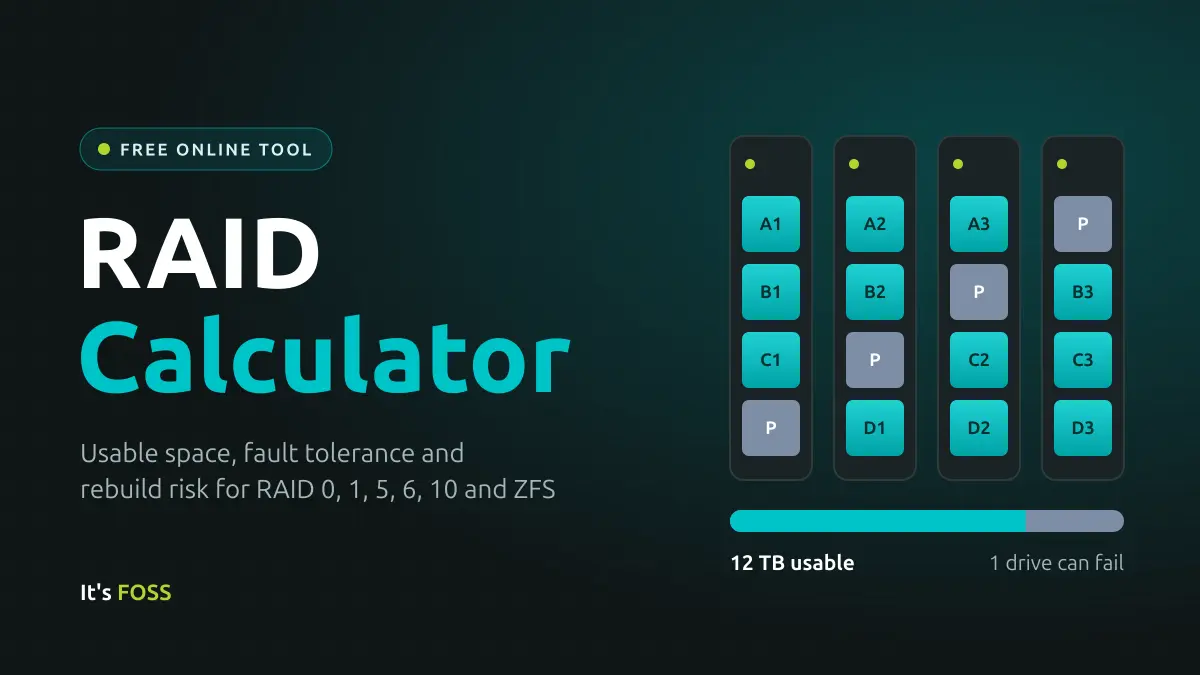
Single-parity layouts, including RAID 5 and its ZFS counterpart RAIDZ1, require a minimum of three drives and yield a usable capacity of N minus one multiplied by S, maintaining protection against a single drive failure. For environments requiring higher security, double-parity configurations such as RAID 6 and RAIDZ2 demand at least four drives, providing a usable capacity of N minus two multiplied by S while tolerating two simultaneous drive failures. Triple-parity configurations like RAIDZ3 further extend this protection to three failed drives starting from a minimum of five disks.
Hybrid configurations, particularly RAID 10, pair drives into mirrors before striping data across those pairs. This setup requires an even number of at least four drives and delivers a usable capacity of N divided by two multiplied by S. While RAID 10 can technically survive multiple drive failures, it can only guarantee survival if the failures are isolated to different mirror pairs. If both drives within the exact same mirror pair fail, the entire array is compromised, which is why risk models typically count it as one guaranteed failure alongside partial multi-failure resilience.
How the Rebuild Risk is Estimated
When a drive ultimately fails within a parity-protected array, the system initiates a rigorous recovery process known as a rebuild or resilver, requiring the controller to read every single sector of the surviving drives in full to reconstruct the lost data. Advanced estimators evaluate the vulnerability of this process by multiplying the total data read during a rebuild by the targeted drive’s Unrecoverable Read Error rating to calculate the statistical probability of encountering at least one unreadable sector before the array is restored.
For instance, examining a configuration of four 8 terabyte drives arranged in a RAID 5 array reveals that a standard rebuild requires reading the three surviving drives in full, amounting to approximately 24 terabytes or roughly 1.9 times 10 to the 14th power bits. Consumer-grade hardware is frequently rated with a specification of one unrecoverable read error per 10 to the 14th power bits read, yielding a theoretical statistical probability of roughly 85 percent of encountering at least one read error during the rebuild window. Enterprise-grade and dedicated network-attached storage drives typically feature improved error ratings of one in 10 to the 15th power bits, dropping the calculated failure risk during a similar rebuild down to approximately 17 percent.
Although physical drives frequently perform better in practice than their conservative manufacturer specification sheets suggest, these statistical models underscore why industry best practices strongly recommend double-parity layouts like RAID 6 or RAIDZ2 for modern high-capacity arrays. Incorporating a second parity drive ensures that encountering a single bad sector or unexpected read failure mid-rebuild does not result in catastrophic data loss.
Platform Compatibility Across Major Hardware Providers
The underlying mathematical models and capacity yields calculated by standard storage utilities apply directly to a wide array of commercial and open-source network-attached storage ecosystems, including hardware and software offerings from Synology, QNAP, UGREEN, and TrueNAS.
Platforms developed by QNAP, UGREEN, and Synology predominantly rely on underlying Linux software RAID implementations, meaning standard configurations such as RAID 1, RAID 5, RAID 6, and RAID 10 deliver identical usable capacities across these different vendor interfaces. For enterprise and enthusiast systems utilizing TrueNAS, capacity planning shifts toward ZFS-specific pool architectures, utilizing ZFS mirrors and RAIDZ variants to achieve similar redundancy objectives through advanced software-defined management.
Scope and Limitations of Capacity Estimation Tools
While storage calculators provide precise mathematical baselines for capacity and redundancy, they intentionally exclude operational performance metrics. Real-world input and output speeds depend heavily on the specific hardware controller, drive specifications, interface bottlenecks, and the nature of the active workload.
Furthermore, calculated capacities represent raw storage prior to accounting for fundamental filesystem overhead. Advanced filesystems like ZFS typically reserve a small percentage of a storage pool for internal metadata and administrative operations, while operating systems traditionally report storage sizes in binary-based units rather than decimal measurements, leading to discrepancies where the reported free space appears lower than initial estimates.
RAID Terms Explained
Analyzing storage configurations requires familiarity with fundamental industry terminology regarding data distribution and system recovery. Striping splits data into sequential chunks written simultaneously across multiple drives, maximizing parallel performance at the complete expense of fault tolerance. Mirroring duplicates identical data streams across multiple physical media, prioritizing safety and fast recovery over raw storage efficiency. Parity utilizes mathematical algorithms to generate auxiliary data blocks, allowing arrays to reconstruct missing information without duplicating entire drive contents.
Single parity reserves an equivalent of one drive’s worth of space for parity data distributed across the array, protecting against a single hardware failure in layouts like RAID 5 and RAIDZ1. Double and triple parity extend this concept across multiple equivalent drives to withstand compound failures, a scenario frequently encountered when a secondary drive fails during the vulnerable rebuild phase following an initial failure.
Rebuilding, or resilvering in ZFS terminology, describes the intensive computational and read-write process of reconstituting a failed disk onto a replacement drive, during which the array operates with temporarily reduced redundancy. Advanced filesystem architectures like ZFS integrate the filesystem and RAID manager into a single entity, utilizing active block-level checksums to detect and automatically repair silent data corruption before it propagates.
Power Draw Estimation and Operational Impact
Evaluating the total cost of ownership for multi-drive storage arrays frequently involves estimating electrical power consumption based on manufacturer specifications. Storage planning tools typically calculate power draw by multiplying the average active or spinning power consumption of an individual drive by the total number of disks deployed in the system.
By factoring in continuous 24-hour daily operation over a yearly cycle, utilities project total kilowatt-hour consumption to provide a baseline comparison between different physical layouts. However, these figures generally account solely for the storage drives themselves, omitting peripheral power losses from system processors, motherboards, cooling fans, and power supply inefficiencies, while potential power savings from idle drive-spin-down features are omitted to maintain conservative estimates.