
The modern digital divide is frequently framed as a simple binary: who has access to the Internet and who does not. However, a growing body of research demonstrates that high aggregate internet penetration is far from a guarantee of equality, equity, or effective connectivity. Territories can differ profoundly not only in the raw availability of infrastructure, but also in the actual performance of the network connections delivered to end users.
A comprehensive study examining fixed-internet access in the Dominican Republic offers a nuanced look at these disparities, shedding light on the complex relationship between regional penetration rates and underlying network performance. The findings present a mixed picture of telecommunications development. While fixed-internet penetration has steadily increased over recent years and overall territorial inequality has generally declined, substantial gaps remain across provinces.
Crucially, the data reveals that provinces boasting higher aggregate penetration rates also tend to experience superior network performance, highlighting a systemic reality: high national averages can easily coexist with deep-seated territorial inequalities that leave specific regions lagging far behind.
The Digital Divide is More Than Being Connected
Historically, global conversations surrounding internet connectivity have prioritized basic access metrics—measuring progress strictly by the percentage of a population that is online. Yet, as experts from the International Telecommunication Union (ITU) and the Office of the United Nations Secretary-General’s Envoy on Technology have emphasized, modern digital policy must account for broader dimensions, including equality of access and effective digital connectivity. Furthermore, a relatively high level of economy-wide internet penetration can easily conceal substantial internal inequalities.
To understand this dynamic, consider the national baseline. According to World Bank Development Indicators, fixed-broadband penetration in the Dominican Republic reached approximately 11.73 subscriptions per 100 inhabitants by 2024. This metric is calculated as the ratio between the total number of fixed-broadband subscriptions and the total population. When placed in a regional context, this figure sits lower than the average observed in Europe, which the Economic Commission for Latin America and the Caribbean (ECLAC) estimates at roughly 19.7 subscriptions per 100 inhabitants. However, it remains comparatively higher than neighboring Caribbean economies, such as Cuba, which hovers around 3.0 subscriptions per 100 inhabitants, and Haiti, which records approximately 0.3 subscriptions per 100 inhabitants.
While the 11.73 figure provides a useful aggregate ratio—effectively serving as a population-weighted mean of provincial penetration levels—it largely offers a population-based perspective. By contrast, an unweighted mean calculated across the nation’s 32 individual provinces provides a distinct territorial perspective.

Utilizing provincial fixed-internet subscription counts and official population estimates provided by the National Statistics Office of the Dominican Republic, researchers calculated fixed-internet density as the number of subscriptions per 100 inhabitants at the local level. Under this localized lens, the average unweighted fixed-internet penetration across the 32 provinces stood at 8.34 subscriptions per 100 inhabitants in 2024.
The resulting gap of 3.39 subscriptions per 100 inhabitants between the aggregate national mean and the territorial mean points to significant density inequalities among provinces. This statistical divergence demonstrates how national averages can mask localized disparities, offering an early indication that digital infrastructure is unevenly distributed across the country’s geography.
A Territorial View of Internet Connectivity
Moving beyond a purely national snapshot motivates a granular territorial analysis—one that evaluates not only who is connected, but also the physical distribution of that access. A deeper examination of penetration inequalities reveals a stark contrast between the regions with the highest and lowest internet density.
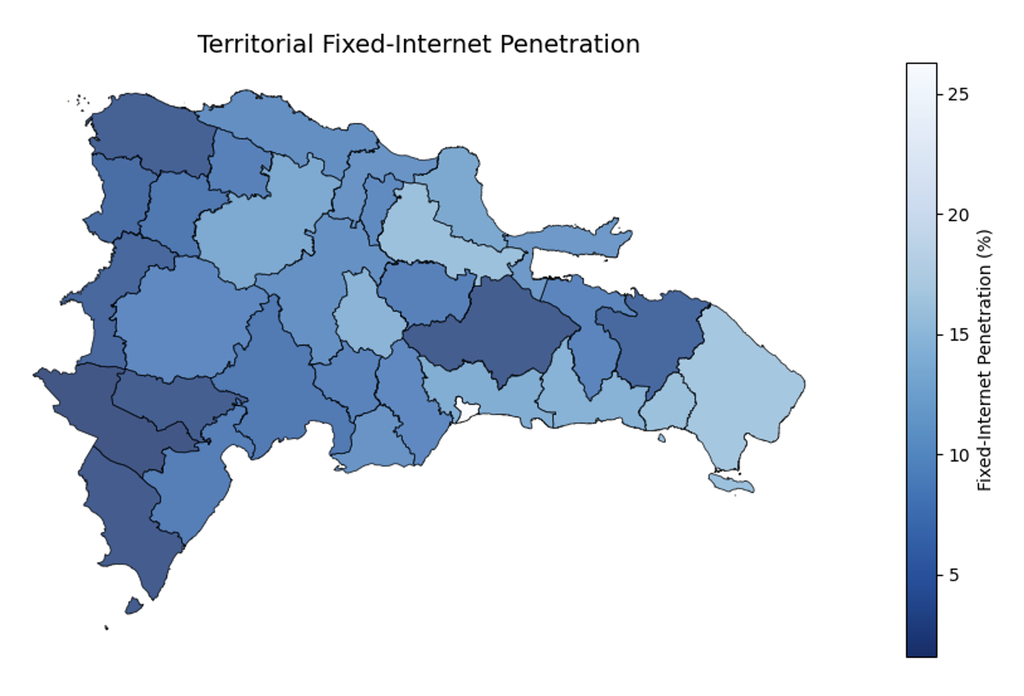
The maximum-to-minimum ratio between the most and least connected provinces reaches a staggering 16.37. At the top of the spectrum is the Distrito Nacional, the national capital and primary economic hub, which recorded a penetration rate of 26.2 percent. At the other end lies Independencia, a southwestern province where penetration languished at just 1.6 percent. In practical terms, fixed-internet penetration in the Distrito Nacional was roughly 16.4 times higher than that observed in Independencia, offering concrete evidence that regional inequalities in digital access cannot be overlooked in national policymaking.
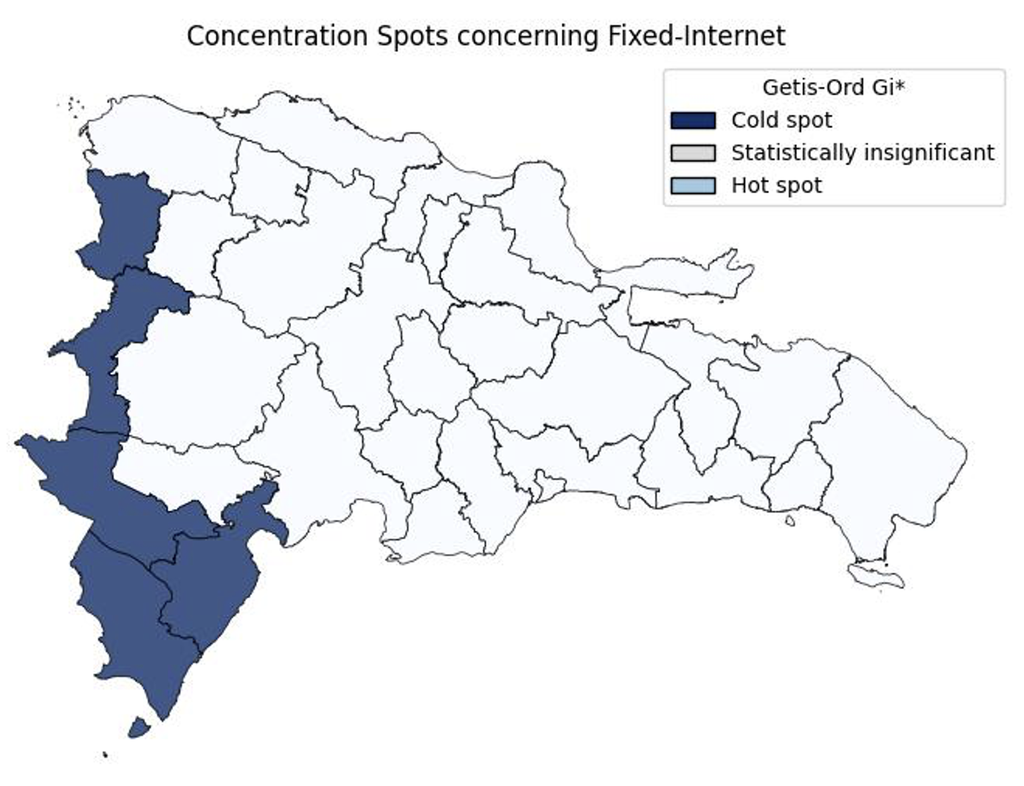
Geographic mapping of these figures illustrates that internet density is far from uniform. A clear territorial pattern emerges along the southwestern corridor of the nation, while the highest concentrations of access are heavily clustered in the Distrito Nacional and La Altagracia, a province globally renowned for its robust tourism sector.
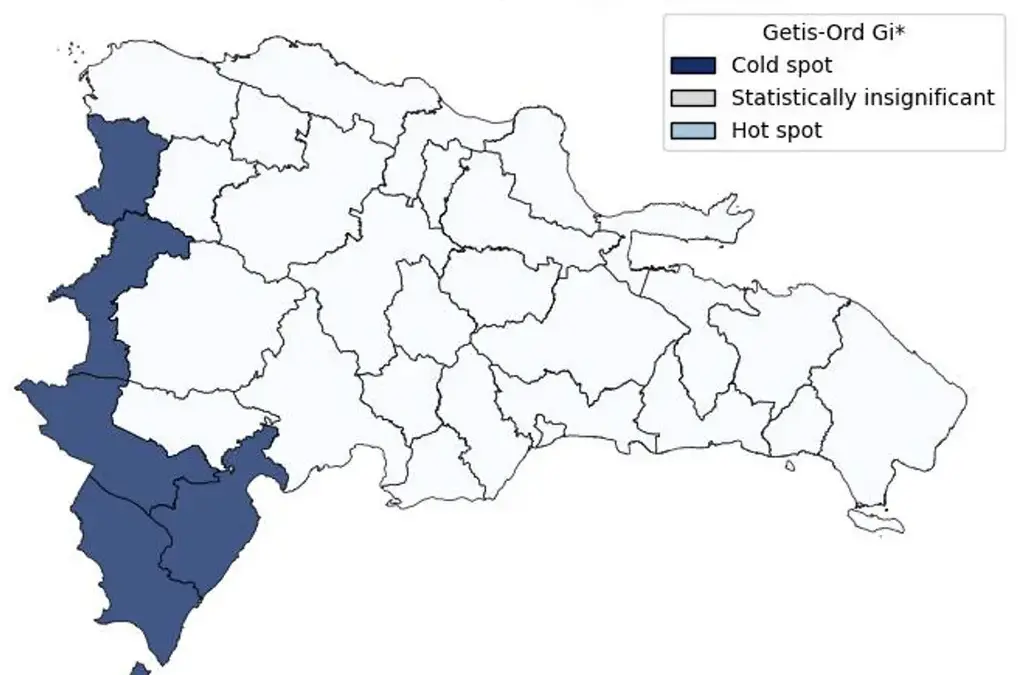
Statistical validation methods, such as the Getis-Ord Gi* spatial analysis tool, elevate these visual observations into empirical evidence. Hot-spot mapping confirms a statistically significant cluster of low internet density spanning the southwestern region of the country, where provincial penetration rates consistently fall below 5 percent.

Interestingly, no statistically significant high-density clusters appear around the Distrito Nacional or La Altagracia under spatial statistics, suggesting that the high penetration levels in these economic powerhouses are relatively localized anomalies. However, because these prosperous provinces house large populations and high subscription volumes, they significantly lift the national aggregate average, effectively masking the severe, localized deficits in connectivity experienced in the southwest.
Are Territorial Inequalities Declining?
While static snapshots illustrate where connectivity is concentrated at a single point in time, they do not explain how these regional inequalities evolve over the long term. To track the changing distribution of digital infrastructure, researchers frequently rely on standardized economic tools such as the Gini coefficient, which measures the equality of resource distribution across a geographic area.
To account for potential shifts toward regional polarization—where a nation might see reduced overall inequality while simultaneously fragmenting into distinct high- and low-connectivity camps—analysts also utilize the Wolfson index.
Data tracking the evolution of fixed-internet access in the Dominican Republic between 2017 and 2024 reveals encouraging trends alongside persistent challenges. Over this seven-year period, the Gini coefficient for fixed-internet density dropped from 0.365 to 0.313. Simultaneously, the Wolfson index declined from 0.321 in 2017 to 0.252 in 2024.
Taken together, these indicators demonstrate that while fixed-internet access remains territorially uneven, both overall inequality and regional polarization have decreased over the analyzed timeframe. However, a slight upward tick observed in the data for 2024 indicates that progress toward digital parity is not necessarily a smooth, continuous trajectory.
The Crucial Dimension of Network Performance
Access metrics and penetration rates alone do not capture the full user experience. As established in foundational networking literature regarding IP network performance, expanding access speed invariably heightens consumer and business expectations regarding the quality of digital service they receive.
To evaluate effective connectivity, it is necessary to examine technical performance indicators, including download speeds, upload speeds, and transmission latency. These distinct metrics describe different functional properties of a network and do not always move in tandem. For instance, a broadband connection may boast a relatively high download capacity while simultaneously suffering from high transmission latency, a flaw that can severely degrade real-time interactive applications like video conferencing or online voice communication.
To explore this dimension of the digital divide, researchers incorporated Ookla fixed-network performance measurements, aggregating download speeds, upload speeds, and latency figures at the provincial level. The 2024 performance data reveal considerable disparities across the country. Provincial average download speeds ranged from a modest 25.53 Mbps to a robust 84.46 Mbps, while upload speeds spanned from 5.83 Mbps to 32.36 Mbps. Meanwhile, network latency varied widely from 9.27 milliseconds to 67.28 milliseconds, confirming that territorial inequalities extend deep into the technical quality of network infrastructure.
To determine whether provinces with higher fixed-internet penetration also benefit from superior network performance, researchers applied Pearson correlation analyses to the 2024 dataset. The results indicate a strong positive correlation between internet density and download speed, registering an r-value of 0.83, as well as upload speed, with an r-value of 0.82.
In practical terms, provinces characterized by higher levels of fixed-internet subscription density also tend to enjoy faster connection speeds. Conversely, network latency demonstrates an inverse relationship, yielding a correlation of r = -0.70. This negative correlation indicates that provinces with higher penetration levels typically experience lower network delay and more responsive connections.
Despite these strong statistical correlations, the relationship is not absolute. High aggregate penetration does not automatically guarantee peak download or upload speeds, nor does it ensure the lowest possible latency in every instance. Because download, upload, and latency metrics capture separate operational characteristics of telecommunications architecture, relying solely on the raw count of subscriptions provides an incomplete and superficial picture of true territorial connectivity.
Examining the broader statistical landscape highlights these variations. Across the provinces, the mean download speed sits at 37.09 Mbps with a standard deviation of 10.83 Mbps, while upload speeds average 16.11 Mbps with a standard deviation of 5.22 Mbps. Latency averages 29.47 milliseconds nationwide, but exhibits a wide standard deviation of 15.37 milliseconds, underscoring the technical fragmentation of the nation’s digital foundations.
Final Thoughts on the Digital Divide: Looking Beyond Penetration
Ultimately, aggregate penetration figures fail to provide a complete understanding of modern digital inclusion. Access metrics, territorial distribution patterns, and network performance indicators each describe fundamentally different perspectives of the same underlying socioeconomic and technological phenomenon.
This multi-dimensional reality offers a clear takeaway for policymakers and researchers tasked with measuring the digital divide. Counting who is connected answers basic questions about access, but evaluating network performance reveals the true quality of that access. Measuring these critical dimensions in tandem is essential for painting an accurate picture of who gets connected—and the actual quality of the connectivity they receive.


Leave a Reply