
The Domain Name System (DNS)—the foundational directory that translates human-readable domain names into machine-readable IP addresses—remains uniquely vulnerable to a deceptively simple tactic known as the "random name attack." Designed to knock online services offline, these attacks saturate a domain’s authoritative nameservers with a continuous flood of queries for fabricated, non-existent names. Because these requests target random labels within a zone, they bypass local recursive resolver caches entirely, forcing the authoritative servers to process every single query from scratch and overwhelming them under a massive wave of artificial traffic.
To better understand how the global DNS infrastructure handles requests for non-existent names and how different types of negative responses impact server load, researchers at APNIC Labs have conducted an extensive, multi-year measurement study. By comparing modern data gathered in August 2026 with baseline figures from 2019, the researchers shed new light on the hidden dynamics of query repetition and highlighted how various protocol responses can inadvertently transform transient network hiccups into massive, self-inflicted traffic storms.
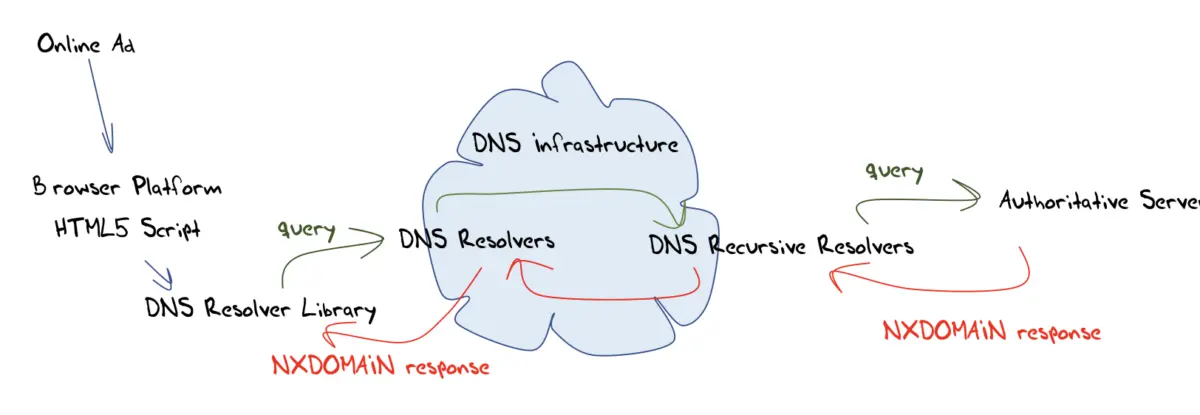
The research methodology relies on a straightforward yet powerful technique. APNIC Labs embeds measurement scripts within online advertisements served to millions of distinct endpoints daily across the global internet. When an advertisement is displayed, the client’s browser or operating system triggers a DNS resolution query for a randomly generated, non-existent domain name. Because the domain belongs to an experimental zone operated exclusively by the researchers, the ensuing traffic routed through global recursive resolvers lands directly on APNIC’s authoritative name servers. This approach provides a vast, geographically diverse cross-section of real-world internet traffic, capturing how different operating systems, client stub resolvers, and recursive forwarding architectures behave when confronted with various DNS response codes.

When analyzing how clients handle negative responses, network engineers must first look at standard client behavior. Under normal conditions, an application generates a DNS query that is picked up by the local stub resolver library on the end host. Because DNS typically operates over the User Datagram Protocol (UDP)—a connectionless protocol that offers no delivery guarantees—stub resolvers incorporate built-in timers and retry mechanisms. If a response does not arrive within a specified window, the query is retransmitted. More advanced operating systems, such as Microsoft Windows, utilize carefully tuned exponential back-off timers and query multiple configured recursive resolvers sequentially before giving up. Furthermore, modern client configurations implement "Happy Eyeballs" dual-stack strategies, rapidly issuing parallel queries for IPv4 "A" records, IPv6 "AAAA" records, and increasingly, "HTTPS" records to determine modern protocol support.
When APNIC researchers conducted their initial negative response measurements in October 2019, utilizing roughly 60 million measurement samples, they observed an average of 2.37 queries per unique queried name. Even when factoring in IPv6 adoption rates at the time and potential UDP retransmissions caused by standard network latency, the observed query volume noticeably exceeded theoretical expectations, hinting at hidden layers of query repetition within the broader DNS forwarding chain.
To see whether these patterns had shifted over the intervening seven years, APNIC Labs repeated and expanded the experiment during the first half of August 2026. Leveraging a massive pool of over 115 million endpoints gathered via global ad campaigns, the researchers evaluated how modern internet clients respond to various negative response codes under clear-channel DNS over UDP.
When examining the classic NXDOMAIN response—Code 3, which explicitly informs the querier that a requested domain name does not exist within the zone—the 2026 data revealed a significant jump in traffic volume. Across more than 115 million tests, the researchers recorded over 509 million queries, translating to an average of 4.40 queries per unique domain name. This rise was driven in part by expanded client capabilities: approximately 48% of tested endpoints queried for both A and AAAA records simultaneously, while 39% also issued queries for HTTPS records. However, factoring in these modern query types still left a substantial remainder of traffic consisting purely of query repeats, with repeat queries averaging a repetition rate of 2.5 times across the entire dataset, and over 6 times among endpoints that engaged in repetition.

The study also investigated alternative forms of negative responses to measure their relative efficiency. One notable alternative is the NOERROR / NODATA response, which utilizes a response code of zero. Rather than declaring that an entire domain name does not exist, a NOERROR / NODATA response indicates that while the query was successfully processed, no resource records of the specified type are associated with that name. Interestingly, the APNIC data showed that NOERROR / NODATA performed slightly more efficiently than NXDOMAIN, generating an average of 3.93 queries per test and exhibiting a lower average repeat query rate.
By contrast, indeterminate or error-based responses triggered severe operational consequences. The SERVFAIL response—Code 2, which indicates that a server was unable to fulfill a request due to internal errors, configuration issues, or DNSSEC validation failures—produced astonishingly high traffic volumes. Testing the SERVFAIL response resulted in an average of 51.29 queries per test, more than ten times the query load observed with definitive negative responses like NXDOMAIN or NOERROR / NODATA. Rather than accepting the failure and halting, recursive resolvers routinely assumed the error was transient and aggressively re-queried the server, creating a massive, compounding traffic amplification effect.
Similarly, the REFUSED response—Code 5, which signifies that a server received a query but declined to answer due to administrative policy or access controls—resulted in an average of 11.47 queries per test. While significantly lower than the extreme query storms triggered by SERVFAIL, REFUSED still induced substantial query repetition as resolvers probed for alternative paths. The most extreme behavior, however, was observed when servers simply remained silent and provided no response at all. Without any explicit feedback, resolvers relied entirely on UDP timeout intervals, pushing the average query count to an overwhelming 83.46 queries per test.
The comprehensive findings underscore a critical operational reality for internet infrastructure engineers: definitive negative responses, such as NXDOMAIN and NOERROR / NODATA, succeed in keeping query repetition within manageable bounds, mirroring the baseline repetition profile of positive responses. Conversely, indeterminate responses like SERVFAIL or total silence act as potent multipliers, inadvertently sparking intensive query storms that can exacerbate denial-of-service conditions. APNIC researchers plan to explore the underlying software mechanics of these repeat queries—including the specific roles played by UDP transport implementations and complex multi-tier resolver architectures—in subsequent studies.

Leave a Reply