
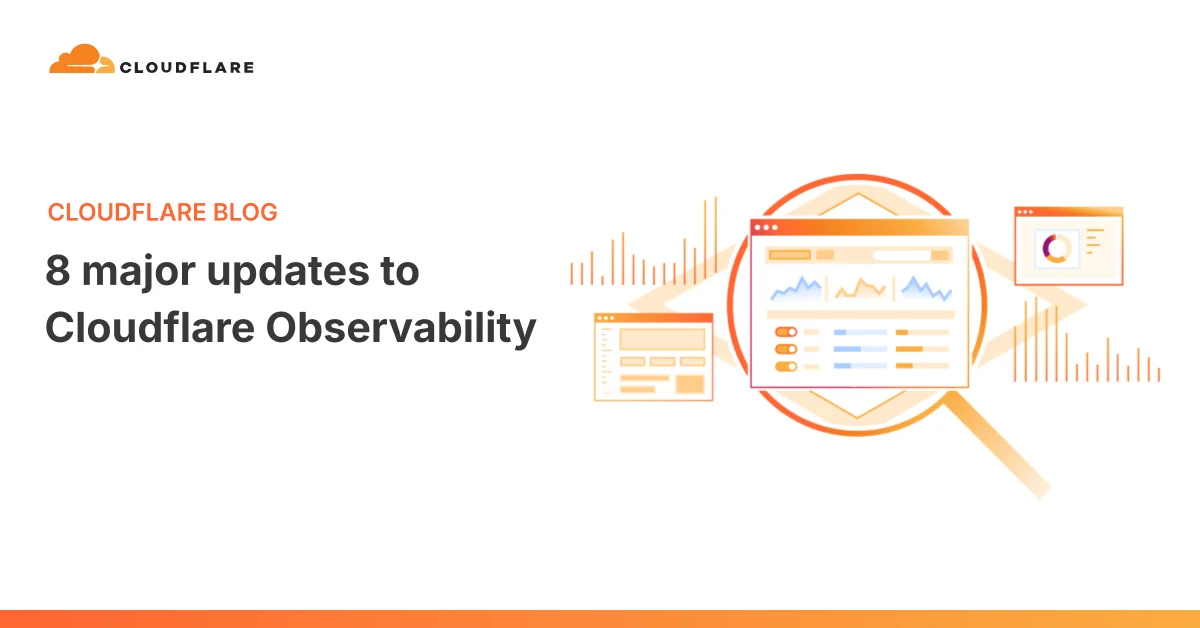
Cloudflare has announced a major consolidation of its observability infrastructure, launching eight sweeping updates designed to bring logs, traces, analytics, alerts, dashboards, and data exporting into a single, cohesive platform. The initiative addresses a long-standing challenge for developers and operations teams: investigating application issues across a globally distributed edge network often required piecing together telemetry from disparate products, each with its own query language, interface, and pricing model. By unifying these capabilities and introducing predictable, volume-based pricing, Cloudflare aims to eliminate the traditional "black box" experience of managing web applications and edge compute resources.
The modern cloud environment demands deep visibility, particularly as applications increasingly rely on serverless architectures, edge workers, containers, and AI gateways. Historically, diagnosing a spike in 5xx error responses could require navigating multiple silos—determining whether the failure originated within a specific Worker, an origin server, or Cloudflare’s global or regional routing logic. The newly launched platform serves as a foundational step toward a unified observability experience. Over the coming months, Cloudflare plans to integrate additional products, datasets, and workflows into this shared ecosystem, establishing consistent product behaviors and streamlined feature sets across the board.
Investigating All Logs in a Single Location
At the core of the rollout is the new Logs home, which successfully bridges Workers Observability—utilized for debugging serverless applications and their connected resources—with Log Explorer, the primary tool for searching security and edge logs. Engineers can now access a wide array of log datasets, including HTTP events, firewall logs, Workers, Containers, R2 storage operations, and AI Gateway traffic, all within the same investigative environment.
This consolidation allows teams to move fluidly from a macro-level observation, such as an increase in request latency, down to granular inspections without switching contexts. Users can group data by hostname or data center, narrow results down to specific affected paths, and investigate individual requests using unique Ray IDs. Queries can be executed using raw SQL or built-in filters, while natural language capabilities assist in creating visualizations and understanding detected anomalies. Furthermore, upcoming support for cross-dataset querying will soon enable developers to connect related events spanning multiple products in a single operation.
Bringing Tracing to Open Beta Across the Entire Platform
Complementing the log updates, Cloudflare has launched its platform-wide tracing capabilities into open beta. Cloudflare Traces offers a request-level perspective on security rules, transformations, cache decisions, routing logic, Workers execution, and origin handling. This deep visibility allows engineers to visualize exactly how traffic traverses the network infrastructure, bridging the gap between platform configuration choices and real-world performance metrics such as processing time and routing efficiency.
To manage data volume effectively, teams can establish baseline sampling rates for continuous visibility while leveraging dynamic trace rules to capture specific traffic patterns at a higher frequency during active incident investigations. Traces can be targeted by specific hostnames, paths, IP addresses, or request headers, and inspected directly within the Cloudflare dashboard. To ensure interoperability with existing observability stacks, the platform supports OpenTelemetry for trace exports, alongside W3C trace context propagation for accepting incoming trace contexts and forwarding them seamlessly to origin servers.
A Unified SQL API and Native Worker Bindings
To accommodate the growing automation needs of engineering teams and autonomous software agents, Cloudflare has introduced a unified SQL API, currently in beta. This interface standardizes telemetry queries across the entire platform. Instead of maintaining separate integrations for Workers logs, container security events, HTTP request logs, and analytics data, humans and software agents alike can query all datasets using a single SQL dialect, authentication mechanism, and API endpoint.

Agents can interact with this data using the newly released Cloudflare CLI tool or connect through Cloudflare’s Observability Model Context Protocol server. To facilitate adoption, comprehensive dataset schemas, fields, and example queries are readily available. Additionally, Cloudflare is bringing this SQL interface directly into the Workers runtime via a native binding. This allows serverless applications to query Analytics Engine data internally—enabling use cases such as metering customer usage, powering billing workflows, generating automated health reports, and driving incident investigations without the overhead of configuring an external API client.
Transitioning to Simplified, Volume-Based Pricing
In tandem with these technical enhancements, Cloudflare is overhauling its subscription and pricing model for ingested and stored logs and traces. Scheduled to take effect on December 1, 2026, across all self-serve plans—and upon contract renewal for Enterprise customers—the new pricing structure eliminates fragmented, event-based metering in favor of a straightforward model based strictly on the volume of data ingested and stored.
The updated pricing applies universally to the Developer Platform’s logs, including Workers, Containers, AI Gateway, and all tracing data. Free tier users will receive 0.5 GB of ingestion per day with a seven-day retention period. Paid and Enterprise plans will include 50 GB of ingestion and 10 GB-months of storage per billing cycle, with retention periods expanding up to one year. Additional usage beyond these allowances will be billed at transparent, predictable rates per gigabyte, significantly lowering the barrier to entry for comprehensive data retention and analysis.
Advanced Custom Alerts and Upgraded Domain Analytics
Monitoring and notification systems have also received a comprehensive upgrade, with the newly rebranded "Alerts" feature now supporting custom rules built directly on top of the unified SQL API. Engineers can configure alerts based on any supported telemetry signal, including HTTP request logs, Workers events, Analytics Engine datasets, traces, and security events. By defining conditions through the dashboard or via custom SQL, teams can set thresholds, track anomalies, or monitor Service Level Objectives with specific evaluation windows.
These alerts can be routed directly to established incident management tools, chat platforms, and webhooks. With webhooks now available across all plans, organizations can easily channel alerts into custom services or feed them directly to automated agents to initiate rapid incident response protocols. Alongside alerting improvements, Cloudflare has unified its domain analytics, combining traffic, performance, security, cache, origin, and DNS metrics into a single view. Furthermore, all plans now benefit from 30-day data retention for domain analytics, providing teams with ample historical context to investigate past anomalies and differentiate one-time traffic spikes from broader operational trends.
Custom Dashboards and Expanded Logpush Availability
Recognizing that prebuilt dashboards cannot capture every unique application topology, Cloudflare has introduced Custom Dashboards. These allow teams to synthesize analytics, logs, traces, and security events from across the entire ecosystem into tailored monitoring views. Tracked metrics—ranging from request volumes and error rates to storage usage and blocked traffic—can be easily shared across teams, ensuring that critical application signals are monitored in a centralized location.
In a significant move for data export capabilities, Logpush—previously reserved exclusively for Enterprise customers—is now available on all self-serve plans. This enables users to stream all Cloudflare logs to their preferred external destinations. To simplify data pipelines, Logpush Transformers have reached general availability, allowing developers to apply SQL-based transformations, data filtering, redaction, and enrichment directly at the edge without maintaining a separate Extract, Transform, Load infrastructure. Usage-based pricing for Logpush and Transformers features a monthly free allowance accompanied by straightforward rates for higher volumes.
As software development increasingly incorporates autonomous agents capable of writing, deploying, and maintaining code, the demand for transparent operational data has never been greater. By grounding its observability suite in open standards like OpenTelemetry, W3C Trace Context, and standard SQL, Cloudflare is providing both human engineers and software agents with the portable, standardized interfaces necessary to close the loop between code changes and operational outcomes.
Leave a Reply