For decades, the global conversation surrounding the digital divide has focused primarily on a binary metric: who is connected to the internet and who is left behind. However, a comprehensive new study reveals that high internet penetration rates are far from a guarantee of equality, effective connectivity, or consistent network performance. Using the Dominican Republic as a detailed case study, researchers highlight how national averages can mask profound territorial inequalities and stark differences in the actual quality of service experienced by end-users.
The findings present a complex picture of modern digital expansion. While fixed-internet penetration has steadily increased and overall territorial inequality has seen a downward trend over the years, substantial disparities persist. Crucially, provinces boasting higher penetration rates also tend to enjoy superior network performance, proving that high aggregate penetration can comfortably coexist with deep, localized digital inequality.
The Digital Divide is More Than Being Connected
Historically, policymakers and international organizations have measured digital inclusion through the basic lens of household or individual access. Yet, this narrow perspective fails to capture the full scope of modern connectivity. According to guidelines from the International Telecommunication Union (ITU) and the Office of the UN Secretary-General’s Envoy on Technology, achieving universal meaningful digital connectivity requires evaluating additional dimensions, including equity in access, affordability, and effective performance. Furthermore, relatively high economy-level internet penetration figures can easily conceal significant inequalities operating beneath the surface.
To understand this phenomenon, one can look at World Bank Development Indicators for the Dominican Republic, where fixed-broadband penetration reached approximately 11.73 subscriptions per 100 inhabitants in 2024. This metric is calculated using the ratio between total fixed-broadband subscriptions and the total population. While this figure falls below the European average of roughly 19.7 subscriptions per 100 inhabitants—as reported by the Economic Commission for Latin America and the Caribbean (ECLAC)—it sits considerably higher than neighboring Caribbean nations such as Cuba, which hovers near 3.0 subscriptions, and Haiti, which records approximately 0.3 subscriptions per 100 inhabitants.

However, the aggregate ratio of 11.73 subscriptions per 100 inhabitants primarily offers a population-weighted, macro-level perspective. When shifting to an unweighted mean across the nation’s 32 provinces using data from the National Statistics Office of the Dominican Republic, a different territorial reality emerges. The unweighted average fixed-internet penetration across all 32 provinces stands at just 8.34 subscriptions per 100 inhabitants for 2024.
This resulting gap of 3.39 subscriptions per 100 inhabitants between the aggregate and territorial means points directly to hidden density inequalities among provinces. It serves as an early indicator that fixed-broadband infrastructure is distributed unevenly across the country’s geography, warranting a deeper territorial investigation.
A Territorial View of Internet Connectivity
A comprehensive approach to digital connectivity demands a territorial analysis that evaluates not simply who has an active subscription, but how network density varies across regions. A granular look at penetration inequalities reveals a staggering max/min ratio of 16.37 between the provinces with the highest and lowest internet density.
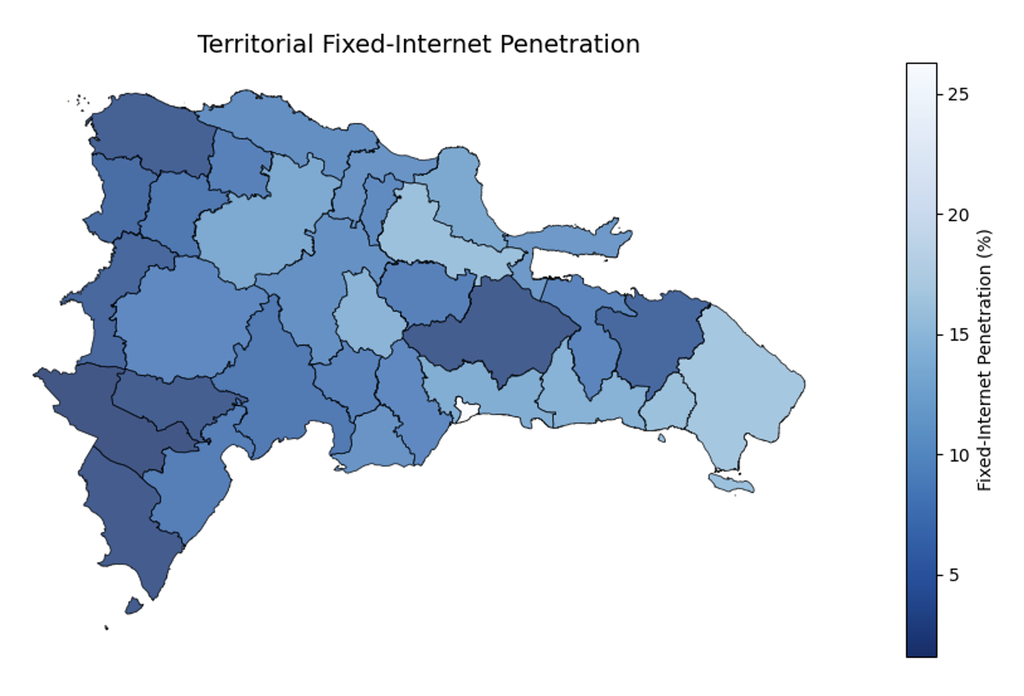
At the top of the spectrum is Distrito Nacional, the nation’s political and economic capital, with a penetration rate of 26.2%. At the other end lies Independencia, a southwestern province recording a penetration rate of just 1.6%. In practical terms, fixed-internet penetration in Distrito Nacional is approximately 16.4 times higher than that observed in Independencia, providing undeniable evidence of deep territorial imbalances in basic digital infrastructure.

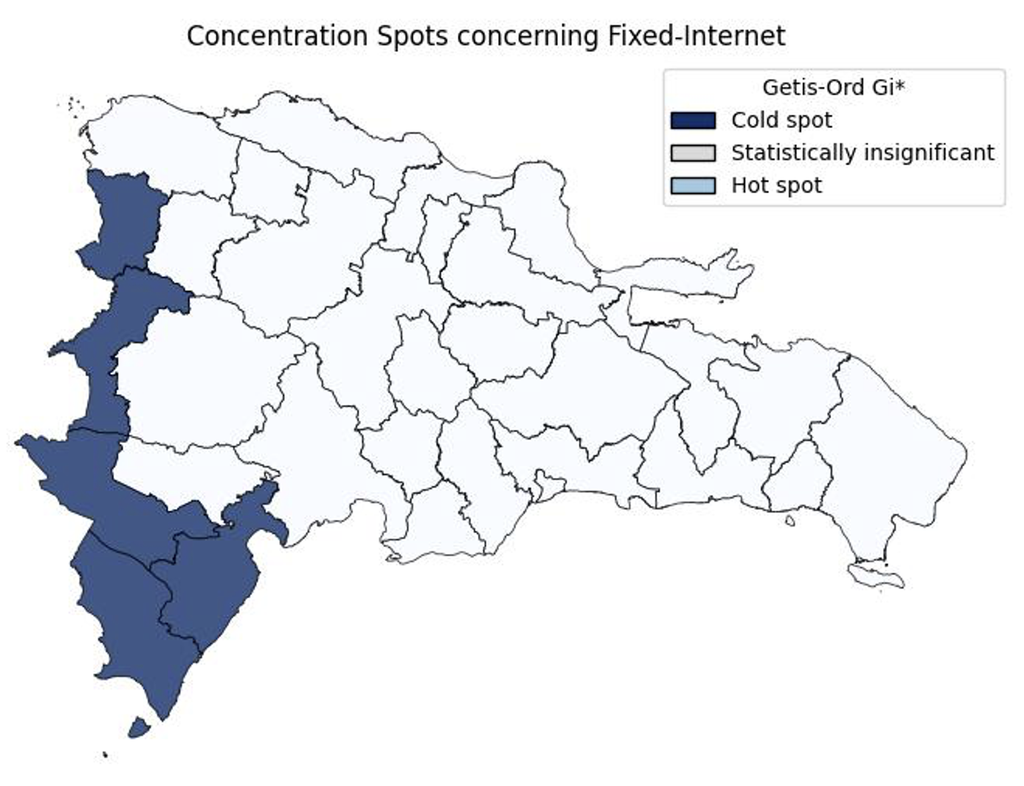
Geographic mapping of these figures illustrates a clear spatial pattern. High internet density is heavily concentrated in Distrito Nacional and La Altagracia, a province globally renowned for its booming tourism industry. Conversely, lower access levels form distinct regional clusters, particularly across the southwestern part of the economy.
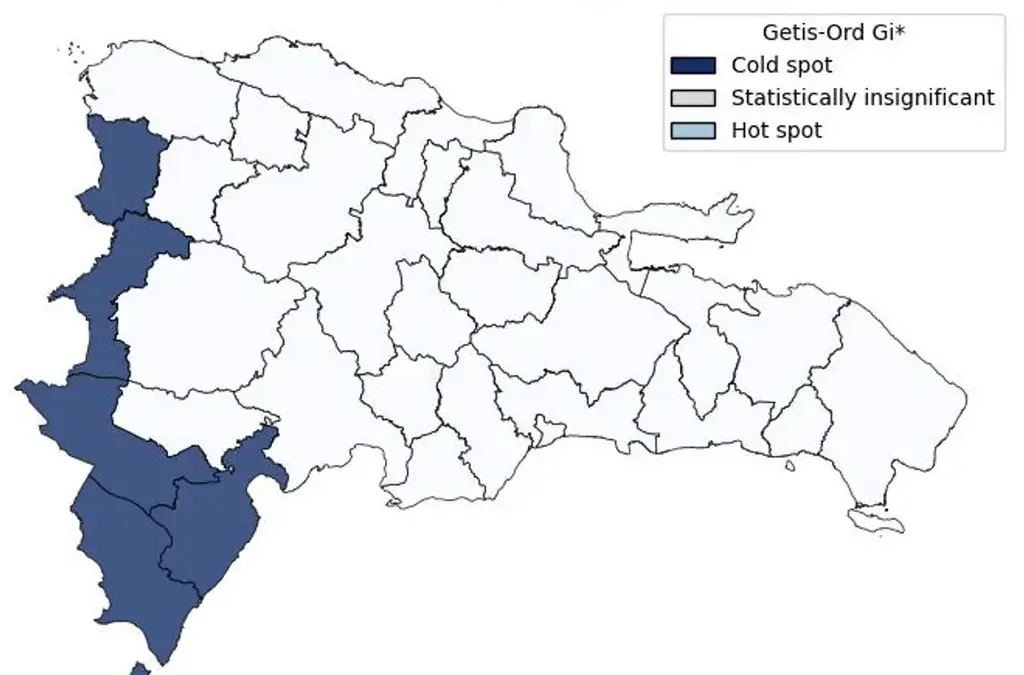
Advanced spatial statistical methods, such as the Getis-Ord Gi* hot-spot analysis, confirm these visual patterns with hard statistical evidence. The data identifies a statistically significant cluster of low internet density along the southwestern corridor, where provincial penetration rates routinely drop below 5%. Meanwhile, the high-penetration hubs of Distrito Nacional and La Altagracia do not form broad regional clusters, indicating that their superior connectivity is relatively localized. Consequently, dense, high-performing urban and tourism centers can disproportionately inflate national aggregate statistics, effectively masking severe connectivity deficits in rural and peripheral regions.
Are Territorial Inequalities Declining?
While static snapshots of provincial penetration highlight current disparities, tracking these metrics over time reveals how regional inequalities evolve. Econometric tools like the Gini coefficient offer a clear summary of how equally or unequally a resource—in this case, fixed-internet density—is distributed across administrative territories.
However, measuring general inequality is distinct from capturing polarization. A regional distribution can become less unequal overall while simultaneously concentrating into two distinct geographic clusters: one characterized by very low connectivity and the other by high connectivity. To capture this dynamic, researchers also utilize the Wolfson index.
Longitudinal data tracking the Dominican Republic between 2017 and 2024 shows a positive trajectory in overall distribution. The Gini coefficient for fixed-internet density fell from 0.365 to 0.313 over the seven-year period. Simultaneously, the Wolfson index dropped from 0.321 in 2017 to 0.252 in 2024. Taken together, these indicators demonstrate that while fixed-internet access remains geographically unequal, both overall inequality and polarization have trended downward. Nevertheless, minor fluctuations, such as a slight upward tick observed in 2024, indicate that this narrowing of the digital divide has not followed a perfectly linear path.
Network Performance and Effective Connectivity
Penetration counts and subscription densities tell only part of the story. As internet speeds and data consumption grow, user expectations regarding the actual quality of service increase correspondingly. True digital inclusion relies not just on possessing a subscription, but on effective connectivity defined by robust network performance indicators such as download speed, upload speed, and transmission latency.
These technical metrics evaluate different properties of network infrastructure and do not always move in tandem. For example, a broadband connection may offer adequate download speeds while suffering from high latency, a combination that severely degrades real-time applications like video conferencing, online education, and interactive enterprise tools.
Utilizing Ookla fixed-network performance measurements aggregated at the provincial level for 2024, researchers uncovered wide performance gaps across the country. Provincial average download speeds ranged widely from a sluggish 25.53 Mbps to a robust 84.46 Mbps, while upload speeds spanned from 5.83 Mbps to 32.36 Mbps. Furthermore, network latency varied dramatically from a responsive 9.27 milliseconds to a delayed 67.28 milliseconds, confirming that territorial performance inequalities mirror access disparities.
Statistical correlation using the Pearson coefficient confirms a strong relationship between infrastructure density and network quality. Provincial internet density exhibits a strong positive correlation with download speed, registering an r-value of 0.83, and an equally strong correlation with upload speed at r = 0.82. This indicates that provinces with higher fixed-internet penetration also tend to benefit from superior connection speeds.
Latency displays the inverse relationship, yielding a strong negative correlation of r = −0.70. Provinces with higher penetration levels generally experience lower network delay and greater responsiveness. Despite these strong correlations, the relationship is not absolute. High penetration does not automatically guarantee maximum speeds or minimal latency everywhere, reinforcing the conclusion that looking solely at subscription counts provides an incomplete and superficial picture of true regional connectivity.
Ultimately, aggregate penetration figures obscure more than they reveal. Evaluating access, territorial distribution, and network performance as interconnected dimensions provides a much more accurate understanding of who is truly connected and the quality of the digital experience they receive. Dr. Wilson Ramírez, a telecommunications researcher and lecturer who authored the study, emphasizes that measuring these varied dimensions together is essential for addressing the modern digital divide effectively across the Caribbean and beyond.