
For decades, the global conversation surrounding the digital divide has focused heavily on a simple binary metric: who has access to the Internet and who does not. International development agencies, telecommunications regulators, and governments have traditionally measured progress through aggregate penetration rates, tracking the raw number of subscriptions against total population counts to gauge national digital maturity. However, a growing body of research demonstrates that high internet penetration is far from a guarantee of true equality or effective connectivity. Territories can—and often do—differ wildly not only in the physical availability of internet access, but also in the underlying performance and quality of the connections delivered to everyday users.
A comprehensive new study examining fixed-internet access in the Dominican Republic sheds critical light on these hidden disparities. The research explores the complex intersection of territorial inequality, infrastructure distribution, and network performance, using the Caribbean nation as an insightful case study. The findings present a multifaceted picture of national digitalization. While fixed-internet penetration has steadily increased over recent years and territorial inequalities have shown signs of an overall decline, substantial gaps remain entrenched across the country’s provinces. Furthermore, the study reveals a strong correlation between high aggregate penetration and superior network performance, proving that national averages frequently mask deep regional divides.
The Digital Divide is More Than Being Connected
Historically, discussions regarding internet connectivity have centered on basic inclusion. Yet, as highlighted by frameworks from the International Telecommunication Union (ITU) and the Office of the UN Secretary-General’s Envoy on Technology, modern digital policy must account for deeper dimensions, including equity in access, quality of service, and effective connectivity. Relying solely on economy-wide penetration figures can obscure significant localized inequalities, painting an overly optimistic picture of a nation’s digital landscape.
For example, World Bank Development Indicators show that fixed-broadband penetration in the Dominican Republic reached approximately 11.73 subscriptions per 100 inhabitants in 2024. This metric, calculated as the ratio between total fixed-broadband subscriptions and the entire national population, provides a useful macro-level benchmark. It sits comfortably above neighboring Caribbean economies such as Cuba, which hovers around 3.0 subscriptions per 100 inhabitants, and Haiti, which records approximately 0.3 subscriptions per 100 people. At the same time, it remains below the regional averages observed in parts of Europe, where the Economic Commission for Latin America and the Caribbean (ECLAC) notes penetration rates approaching 19.7 subscriptions per 100 inhabitants.

However, the aggregate figure of 11.73 primarily reflects a population-weighted national mean. When evaluated from a territorial perspective—calculating the unweighted mean across the economy’s 32 individual provinces using data from the National Statistics Office—the average fixed-internet penetration drops to 8.34 subscriptions per 100 inhabitants for the same year.
This noticeable gap of 3.39 subscriptions per 100 inhabitants between the aggregate and territorial means points directly to underlying density inequalities among the provinces. It serves as an early quantitative indicator that digital infrastructure is unevenly distributed across the nation’s geography, hidden beneath the surface of favorable national statistics.
A Territorial View of Internet Connectivity
Moving beyond aggregate numbers requires a granular territorial analysis that evaluates not just who is connected, but the sheer scale of the disparities involved. A closer inspection of provincial data reveals striking contrasts. The maximum-to-minimum ratio between the provinces boasting the highest and lowest internet density stands at an astounding 16.37.
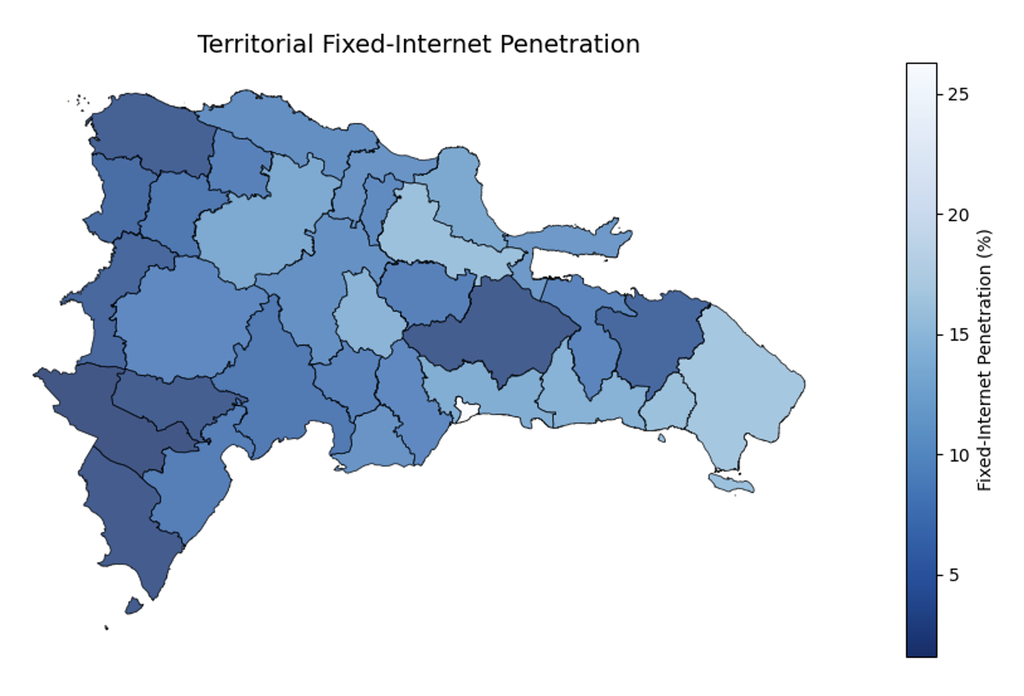
At the upper end of the spectrum, the Distrito Nacional recorded a fixed-internet penetration rate of 26.2%. At the lower end, Independencia registered just 1.6%. In practical terms, fixed-internet penetration in the nation’s capital was roughly 16.4 times higher than that observed in Independencia. This stark magnitude underscores the reality that territorial inequalities in fixed-internet access remain a structural challenge that cannot be dismissed by strong national averages.
Mapping this distribution across the Dominican Republic highlights distinct geographic patterns. High internet density is heavily concentrated in two primary hubs: the Distrito Nacional, serving as the country’s main economic and political center, and La Altagracia, a province globally renowned for its robust tourism and hospitality sector. Conversely, the southwestern region of the country exhibits markedly lower levels of digital infrastructure.

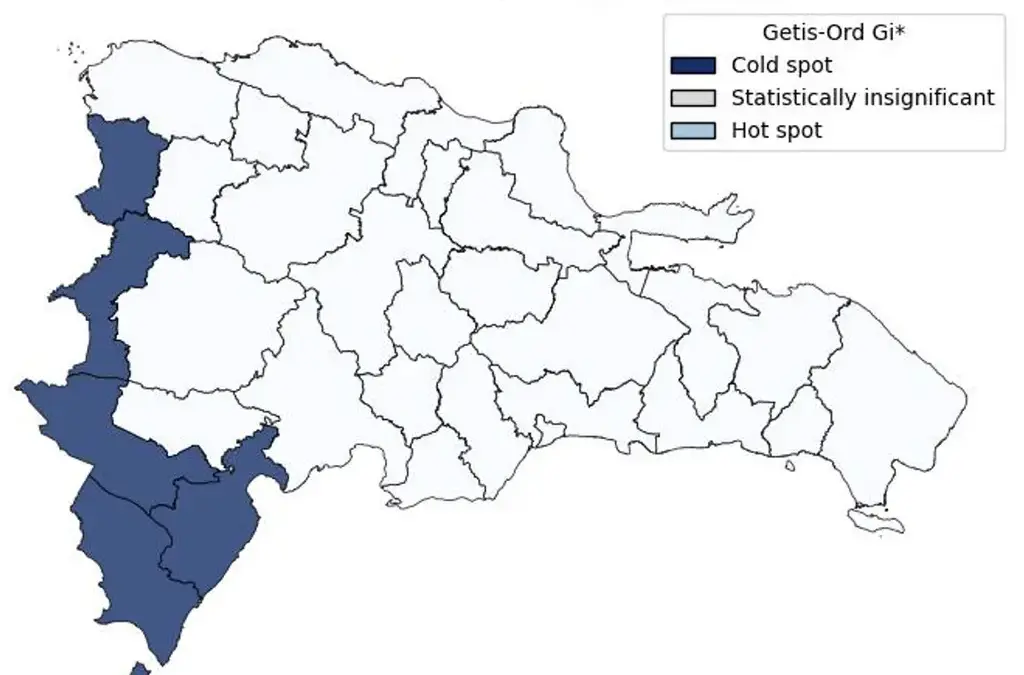
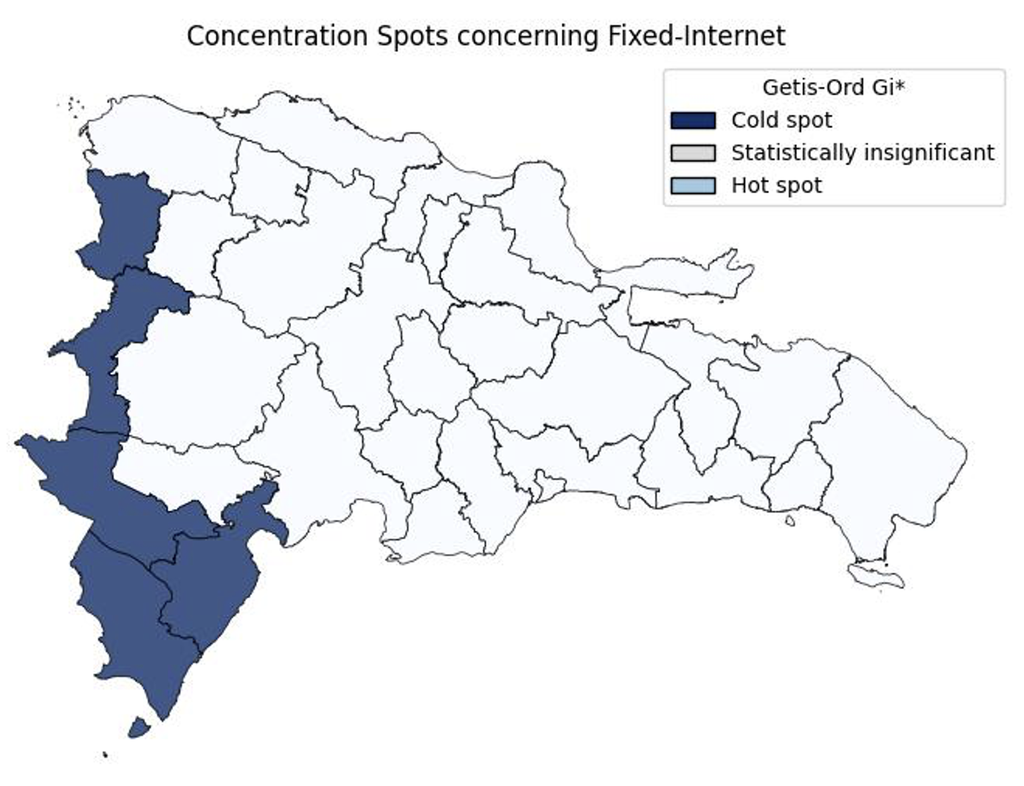
Moving beyond visual mapping, statistical tools provide rigorous evidence of these trends. Applying a Getis-Ord Gi* hot-spot analysis confirms the existence of a statistically significant cluster of low internet density spanning the southwestern part of the economy, where provincial penetration rates routinely fall below 5%. Interestingly, the high-penetration zones in Distrito Nacional and La Altagracia do not form broad statistically significant regional clusters in the same manner, suggesting that their elevated connectivity levels are more localized economic phenomena. Provinces with dense populations and high penetration can heavily skew national aggregate figures, inadvertently masking persistent pockets of low connectivity in peripheral regions.
Are Territorial Inequalities Declining?
While capturing a snapshot of territorial distribution is essential, understanding the trajectory of digital inclusion requires analyzing how these inequalities evolve over time. Researchers frequently rely on established econometric tools to measure the shifting concentration of resources.
The Gini coefficient provides a standard summary of how equally or unequally a resource—in this case, provincial fixed-internet density—is distributed across a territory. However, rising equality does not automatically preclude polarization, as a society can experience reduced overall inequality while simultaneously solidifying into two distinct economic or geographic clusters of high and low connectivity. To capture this dynamic, researchers also track the Wolfson index.
Longitudinal data tracking the Dominican Republic between 2017 and 2024 reveals encouraging trends alongside persistent challenges. During this seven-year span, the Gini coefficient for fixed-internet density decreased from 0.365 to 0.313. Concurrently, the Wolfson index dropped from 0.321 in 2017 to 0.252 in 2024.
Taken together, these indicators demonstrate that while fixed-internet access remains unevenly distributed across the nation’s provinces, both overall inequality and polarization have trended downward over the analyzed period. However, a slight uptick observed in the 2024 data indicates that this journey toward digital equity is not entirely linear, experiencing occasional fluctuations along the way.
Merely tracking subscriptions and penetration rates, however, tells only part of the story. As internet speeds and data capacities expand, consumer expectations regarding the actual quality of service evolve rapidly. Effective connectivity requires evaluating concrete network performance metrics, including download speeds, upload speeds, and transmission latency.
These technical indicators capture distinct dimensions of network behavior and do not always move in tandem. A connection might boast relatively high download speeds while simultaneously suffering from high latency, which can degrade the performance of real-time interactive applications like video conferencing or online gaming.
Analyzing fixed-network measurements from Ookla aggregated at the provincial level for 2024 reveals considerable performance variations across the country. Provincial average download speeds ranged widely from a low of 25.53 Mbps to a high of 84.46 Mbps, with a national mean of 37.09 Mbps and a standard deviation of 10.83 Mbps. Upload speeds displayed a similarly wide spread, spanning from 5.83 to 32.36 Mbps, averaging 16.11 Mbps. Latency figures—measured in milliseconds—ranged from a highly responsive 9.27 ms up to 67.28 ms, with an average of 29.47 ms. These metrics confirm that territorial inequalities extend far beyond simple subscription counts into the core quality of data transmission.
To determine whether infrastructure density translates into superior network performance, researchers utilized Pearson correlation analysis to compare provincial internet density against the three core performance indicators for 2024. The results indicate a strong positive correlation between internet density and download speed, registering an r-value of 0.83, as well as a strong positive correlation with upload speed at an r-value of 0.82.
In practical terms, provinces characterized by higher levels of fixed-internet penetration also tend to benefit from significantly faster connection speeds. Conversely, network latency demonstrates an inverse relationship, yielding a strong negative correlation of r = -0.70. This indicates that provinces with higher penetration levels typically experience lower network delay and greater responsiveness.
Nevertheless, these relationships are not absolute. High penetration does not automatically guarantee the absolute highest download or upload speeds, nor does it ensure the lowest possible latency in every instance. Because download speed, upload speed, and latency each capture fundamentally different characteristics of network infrastructure, relying exclusively on subscription counts provides an incomplete and superficial picture of true territorial connectivity.
Ultimately, aggregate penetration figures alone are insufficient for understanding the modern digital landscape. Access, territorial distribution, and network performance represent three distinct yet deeply interconnected perspectives of the exact same socioeconomic phenomenon.
Measuring who is connected reveals the baseline state of digital access, while evaluating network performance sheds essential light on the actual quality of the internet service delivered to communities. Analyzing these dimensions comprehensively offers a clearer, more honest evaluation of how digital inclusion is distributed across society, providing policymakers with the insights needed to address the remaining gaps in modern connectivity.



Leave a Reply