In the latest installment of Bitcoin Magazine’s "Chart of the Day," host Sean turned his analytical lens toward one of the market’s most reliable on-chain metrics: the Market Value to Realized Value (MVRV) ratio. As Bitcoin experiences a punishing macroeconomic and market-wide pullback, on-chain analytics are offering crucial clues regarding whether the broader crypto market has successfully established a
cyclical bottom or if deeper losses lie ahead for investors.
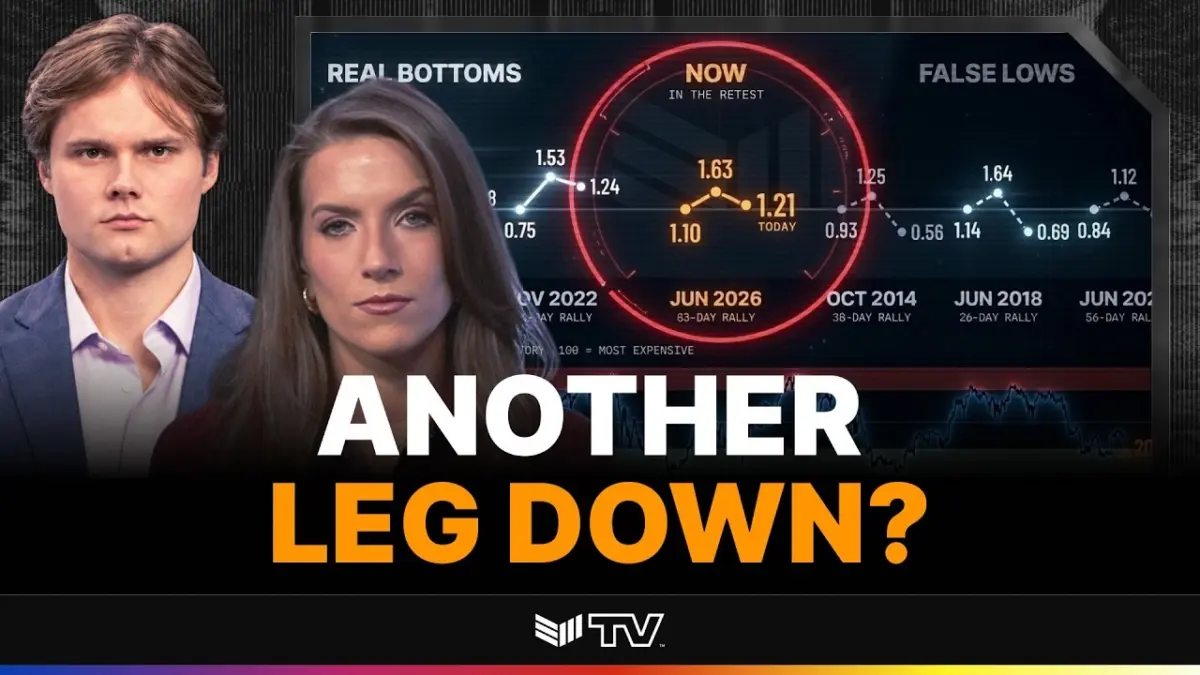
During the broadcast, Sean detailed how the recent market correction has already erased roughly 80% of the gains achieved during the summer relief rally. By evaluating historical parallels, particularly the harsh bear market conditions of 2018, the analysis underscores that simply holding previous local lows, such as the June trough, may ultimately prove insufficient for declaring the bear market over. Instead, market participants are being directed to a definitive line in the sand: an MVRV reading of 1.1, which corresponds roughly to the $59,000 price level. According to the breakdown, this specific threshold will ultimately determine whether Bitcoin’s cyclical bottom is already securely in place.
Bitcoin’s MVRV Score and Current Market Readings
To understand the gravity of the current market structure, Sean began by examining the MVRV ratio and what its current readings indicate about aggregate investor profitability. The MVRV ratio is a foundational on-chain metric calculated by dividing Bitcoin’s market capitalization by its realized capitalization, which values each unspent transaction output (UTXO) at the last time it was moved on-chain. Historically, this indicator has proven remarkably effective at identifying periods when Bitcoin is fundamentally overvalued or undervalued relative to the aggregate cost basis of the entire network.
A lower MVRV score signifies that the average coin on the blockchain is sitting closer to, or even below, its acquisition price, signaling capitulation, fear, and deeply discounted valuations. Conversely, elevated MVRV readings coincide with macroeconomic euphoria and market tops where long-term holders actively distribute supply to eager retail buyers. In the context of the current market cycle, the MVRV score has dipped into regions that historically attract value-driven accumulation, yet Sean cautioned that reaching a cheap valuation does not automatically equate to an immediate, sustained reversal.
Navigating This Cycle’s Lows and the Summer Relief Rally
The trajectory of the current market cycle has been defined by sharp volatility, false dawns, and aggressive counter-trend movements. Earlier in the year, the broader digital asset ecosystem experienced a pronounced relief rally that temporarily injected optimism back into the trading community. Investors hoped that the worst of the macro-driven contagion and forced liquidations had run their course, paving the way for a gradual recovery toward previous highs.
However, the subsequent pullback has aggressively dismantled that optimism. Sean pointed out that the recent downward momentum has already given back approximately 80% of the entire summer rally. Such a severe retracement demonstrates that the relief bounce lacked the structural demand necessary to reverse the overarching bear market trend. Instead, it functioned as a classic bear market trap, drawing in late-stage retail liquidity before rolling over and punishing leveraged long positions. This aggressive retracement has forced market analysts to re-evaluate the strength of the June lows, raising serious concerns about whether those previous price floors can withstand another wave of selling pressure.
Distinguishing True Bottoms From Bear Market Rallies
A recurring theme in macroeconomic and cryptocurrency analysis is the difficulty of distinguishing between a genuine structural bottom and a temporary bear market rally. Throughout previous market cycles, Bitcoin has routinely staged powerful counter-trend rallies that deceived even seasoned market participants into believing a new bull market had begun. These rallies are frequently fueled by short covering, oversold conditions, and transient positive news headlines rather than organic, long-term capital inflows.
True cyclical bottoms, on the other hand, are forged through prolonged periods of sideways consolidation, extreme market apathy, and comprehensive supply distribution from weak hands to high-conviction entities. During these capitulation phases, market participants largely abandon the asset class out of frustration, creating the low-liquidity environment required to build a durable foundation for the next secular bull run. Sean’s analysis emphasizes that understanding where the current price action falls on this spectrum requires looking past daily price fluctuations and focusing instead on underlying structural templates from prior market history.
Parallels Between the Current Cycle and 2018
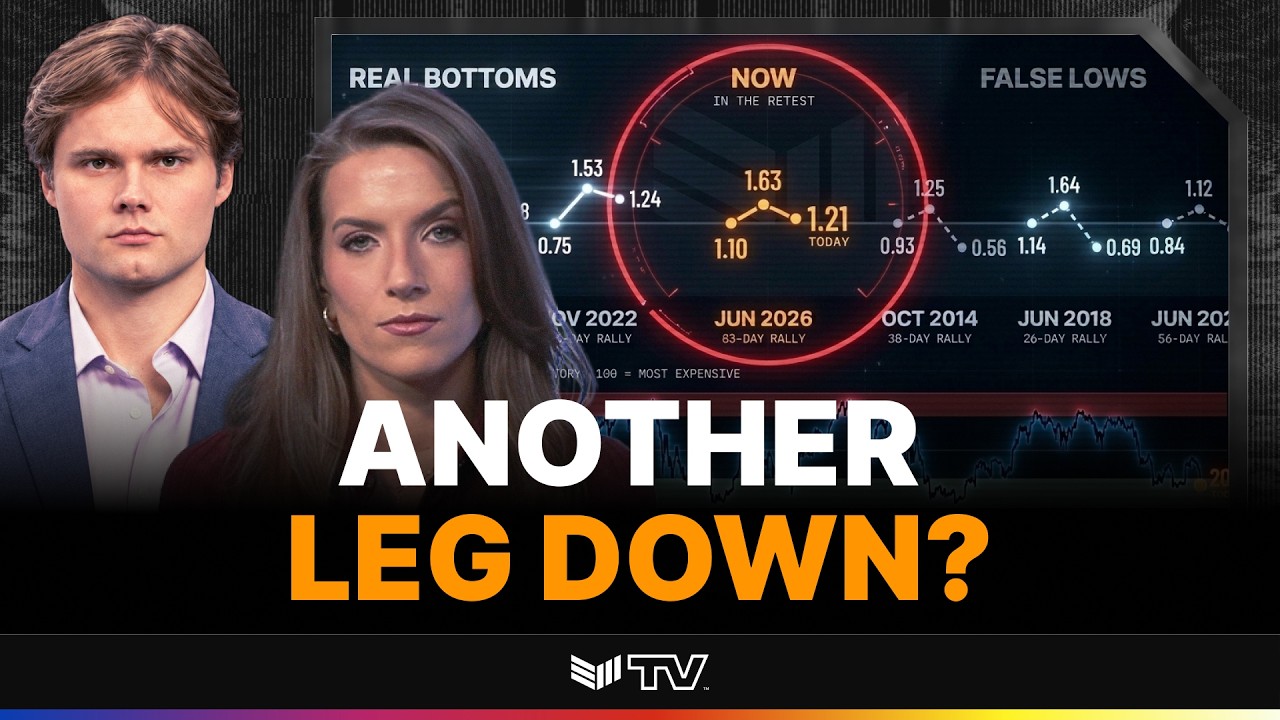
When comparing market structures across different epochs of Bitcoin’s trading history, analysts frequently look for recurring behavioral patterns among market participants. Sean noted that the numerical and structural characteristics of the current market cycle rhyme remarkably with the harsh bear market conditions witnessed in 2018.
During the 2018 bear market, Bitcoin suffered a brutal correction following its late 2017 parabolic peak. The market experienced multiple relief rallies that offered false hope to investors, only to break down further as macroeconomic pressures and structural deleveraging took their toll. Crucially, the behavior of on-chain metrics during that era mirrors the signals currently flashing across the network. By studying how the 2018 cycle unfolded, analysts gain valuable context regarding how long capitulation phases can persist and how deceptive intermediate price recoveries can be before the true macroeconomic floor is secured.
The Line in the Sand: MVRV 1.1 and the $59,000 Threshold
The core takeaway from the latest Chart of the Day analysis centers on a specific quantitative threshold that could dictate the remainder of the market cycle. Sean identified an MVRV score of 1.1—which translates to a Bitcoin spot price of approximately $59,000—as the ultimate line in the sand for the digital asset market.
At an MVRV level of 1.1, the aggregate market valuation closely approaches the realized capitalization of the network, meaning the average holder is sitting on razor-thin profit margins. Historically, maintaining this specific ratio has been critical for preventing deeper macro-driven capitulation events. If Bitcoin manages to defend this level and use it as a launching pad for future accumulation, it strengthens the argument that the macro bottom is already in place. However, a decisive breakdown below an MVRV of 1.1 would invalidate that thesis, opening the door for a much deeper and more prolonged drawdown.
Why Holding the June Low May Not Be Enough
As traders monitor key support levels on the daily and weekly charts, much of the conversation has focused on whether the June low will successfully hold against incoming selling pressure. While defending previous lows is often viewed by retail traders as a bullish validation of market strength, on-chain data suggests a more nuanced reality.
Sean explained that simply holding the June low may ultimately prove insufficient to guarantee the safety of the market. In historical bear markets, previous cycle lows have frequently been breached during final capitulation phases as liquidity dries up and macroeconomic headwinds intensify. Relying solely on horizontal price support without consulting underlying network valuation metrics like MVRV can leave investors vulnerable to unexpected downside volatility. By focusing on the $59,000 threshold and the 1.1 MVRV score, market participants are provided with a more robust, data-driven framework for navigating Bitcoin’s ongoing price discovery.
As the Bitcoin network continues to process transactions and adjust to shifting macroeconomic realities, programs like Bitcoin Magazine’s Chart of the Day remain essential for cutting through market noise. Whether Bitcoin can successfully defend the 1.1 MVRV level or whether it will be forced to test lower valuation bands remains one of the defining financial questions for the digital asset industry.
Disclaimer: The views and opinions expressed in this show are those of the participants and do not necessarily reflect the official policy or position of BTC Inc., Bitcoin Magazine, or any affiliated entities. This content is provided for informational and educational purposes only and should not be construed as investment, legal, tax, or accounting advice. Nothing contained in this show constitutes a solicitation, recommendation, endorsement, or offer to buy or sell any securities or financial instruments. Viewers should consult their own advisors before making financial or business decisions.