
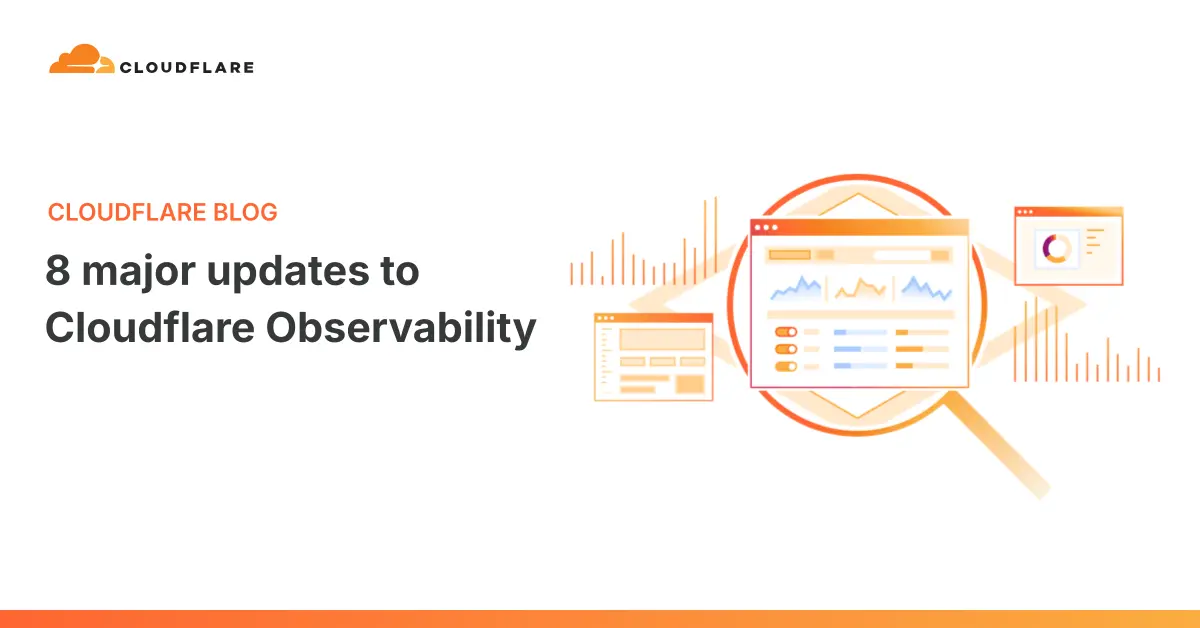
Cloudflare has announced a comprehensive overhaul of its monitoring and telemetry infrastructure, launching a unified observability platform designed to bring logs, traces, analytics, alerts, custom dashboards, and data exporting into a single, cohesive ecosystem. Alongside the platform integration, the company introduced simpler, volume-based pricing, extended data retention periods across multiple tiers, and opened access to advanced features previously locked behind enterprise-grade paywalls.
The sweeping update addresses a long-standing challenge for developers and operations teams: debugging modern web applications often requires piecing together fragmented data signals scattered across multiple products. When a spike in 5xx server errors occurs, the root cause could stem from a serverless Worker, a misconfigured origin server, or a regional connectivity failure between Cloudflare’s global edge and the backend infrastructure. Historically, investigating such incidents required deep knowledge of which product owned each specific signal and how to query it independently.
With today’s rollout, Cloudflare is taking its first major step toward a platform-wide observability experience. Over the coming months, additional products, datasets, and operational workflows will be integrated into this shared ecosystem to ensure consistent pricing, unified product experiences, and streamlined troubleshooting features.
Investigate All Your Logs in One Place
At the heart of the platform release is the newly redesigned Logs home interface, which successfully merges Workers Observability—tailored for debugging serverless code and its connected resources—with Log Explorer, the primary tool for searching security logs. Users can now seamlessly switch between diverse log datasets, including HTTP events, firewall logs, Workers executions, Containers, R2 storage operations, and AI Gateway traffic, all while utilizing a unified set of investigative tools.
During an active incident, engineers can start by analyzing an unexpected surge in request latency, group the traffic by specific hostnames or edge data centers, narrow the scope down to affected URI paths, and inspect individual transactions using unique Ray IDs. If an investigation crosses product boundaries, analysts can switch datasets instantly without exiting the logging interface. Furthermore, Cloudflare announced that cross-dataset querying capabilities will soon roll out, allowing teams to correlate related events across different products within a single query. Telemetry data can be queried directly using raw SQL or filtered using built-in parameters to isolate anomalies, complemented by natural language visualization tools.
Tracing Requests Across the Entire Platform in Open Beta
To provide deeper end-to-end visibility, Cloudflare is launching its platform-wide tracing capability into open beta. Cloudflare Traces offers a granular, request-level visualization of how traffic moves through supported security rules, script transformations, cache decisions, routing logic, Workers execution, and origin server handling. This granular view allows developers to understand precisely how their custom platform configurations influence processing times and routing paths.
Teams can establish a baseline sampling rate for continuous background visibility, then deploy targeted Trace Rules to capture specific traffic streams at higher sampling rates during active troubleshooting sessions. Traces can target specific hostnames, paths, incoming IP addresses, or custom headers, and can be searched effortlessly via Ray ID within the Cloudflare dashboard. To ensure interoperability with external monitoring stacks, traces can be exported using OpenTelemetry, while native support for W3C trace context propagation enables systems to ingest incoming trace headers and seamlessly pass context down to origin servers.
Unified SQL API and Native Workers Integration
Modern infrastructure management increasingly relies on automated systems and AI agents that require programmatic access to telemetry data to investigate issues, correlate signals, and verify remediation steps. To support this shift, Cloudflare has introduced a unified SQL API, currently in beta, that standardizes telemetry queries across the entire platform. Instead of managing separate integrations for Workers logs, container security events, HTTP request logs, and performance analytics, human operators and automated agents can rely on a single SQL dialect, unified authentication model, and consistent API endpoint.
Developers can leverage the newly launched Cloudflare CLI tool, designated as cf, to execute queries directly from the command line, or connect via Cloudflare’s Observability Model Context Protocol (MCP) server. To assist both developers and autonomous agents, comprehensive dataset schemas, field references, and example queries have been made publicly available.
In addition to external API access, Cloudflare is embedding the SQL interface directly into the Workers runtime via a native binding. This allows a serverless Worker to directly query Analytics Engine data to meter customer usage for billing workflows, build customer-facing analytics dashboards, generate automated health reports, or orchestrate autonomous incident responses without requiring a separate API client configuration.

Transition to Usage-Based Ingestion and Storage Pricing
To eliminate unpredictability in billing, Cloudflare is transitioning its entire suite of logs and traces to a unified observability subscription model. Effective December 1, 2026, and applying upon renewal for Enterprise clients, the new pricing structure covers all Developer Platform logs—including Workers, Containers, and AI Gateway—as well as all incoming tracing data.
Because log and trace volumes can vary significantly based on payload size and application architecture, the new pricing model is calculated strictly on the volume of data ingested and stored rather than arbitrary event counts. Under the updated framework, Free tier accounts receive 0.5 GB of daily ingestion with a 7-day data retention window. Paid and Enterprise tiers include 50 GB of ingestion per billing cycle and 10 GB-month of storage, with additional usage billed at $0.25 per gigabyte ingested and $0.10 per gigabyte-month stored. Extended data retention of up to one year is scheduled to launch soon.
Custom Alerts and Expanded Domain Analytics
Cloudflare has significantly upgraded its notification system, rebranding it as "Alerts" and extending custom alert capabilities across everything supported by the new unified SQL API. Engineers can now define alerts directly on HTTP request logs, Workers events, Analytics Engine datasets, security incidents, and traces.
Alert rules can be configured directly within the dashboard or defined using custom SQL expressions. Teams can establish thresholds, monitor for anomalous behavior, or track Service Level Objectives (SLOs) over specified evaluation windows. When conditions are met—such as origin 5xx errors exceeding acceptable limits for five consecutive minutes, recurring container failures, or anomalous latency spikes—alerts can be dispatched directly to incident management platforms, team chat applications, or custom webhooks. Webhooks are now available across all account tiers, enabling automated workflows where alerts can trigger external services or feed directly into AI agents to initiate automated remediation.
Simultaneously, Cloudflare is consolidating domain-level analytics to provide a unified view of traffic, performance, security, caching, origin behavior, and DNS metrics. If latency increases, operators can immediately determine whether the degradation is tied to a specific geographic data center, hostname, or backend server. Furthermore, Cloudflare is extending zone analytics retention to 30 days across every account plan, providing a full month of historical data to help teams investigate past incidents, compare daily trends, and distinguish between one-time anomalies and long-term performance shifts.
Custom Dashboards and Universal Logpush Availability
While prebuilt dashboards handle standard monitoring scenarios, complex applications often span multiple Cloudflare services. The introduction of Custom Dashboards allows teams to aggregate analytics, Workers logs, performance traces, and security events into a single, tailored viewing pane. Users can track request volumes, error rates, latency percentograms, storage utilization, and blocked threat traffic, sharing these centralized views across their engineering organizations.
In a major expansion of data export capabilities, Cloudflare is making Logpush available across all self-serve plans, removing the previous enterprise restriction. This allows any user to stream platform logs directly to their preferred external analysis tools and cloud storage destinations. To assist with data governance, Logpush Transformers has reached general availability, enabling teams to apply SQL-based transformations, data redaction, enrichment, and formatting directly at the edge without maintaining a separate Extract, Transform, Load pipeline.
Usage-based pricing for Logpush and Transformers includes a monthly free allowance of 25 GB for standard exports and 1 GB for transformer operations, with straightforward overage rates for higher volumes.
Cloudflare’s latest observability updates represent a decisive move toward transparency, replacing isolated product silos with standard, portable interfaces built around OpenTelemetry, W3C Trace Context, and SQL. As software operations increasingly transition toward automated agents and programmatic workflows, standardized access to reliable telemetry data ensures that systems can effectively close the loop between detecting an anomaly, identifying its root cause, and verifying the fix.
Leave a Reply